Wavetable Objects
Rio Roye
[1]
Text
Rio Roye’s piece Wavetable Objects debuts a real-time rendering technique which decomposes 3-D models into pitched tones and swarming sonic textures. Foregoing standard 3D light-transport rendering methods, this animation understands 3D objects and the points that comprise them as the basis for complex audio spectra and strobing motion.
The rendering technique at the heart of Wavetable Objects is a two-part algorithm which first parses 3D objects' points into tables of x, y, and z positions.
In the above image, a cube rotating on its vertical axis is paired with two visualizations of the cube's point values. Leftmost is a “spreadsheet” view in which each row denotes one of eight points and each column specifies its x, y, and z values. In the middle, coded in red, yellow, and green, are those same x, y, and z columns plotted horizontally on a graph.
Below is the same diagram but for a sphere with many more points than the cube:
When plotted in this fashion, the points of the object can be thought of as a waveform. Smooth objects with gradual transitions between points tend to have sine-like waveforms whereas the waveforms of objects with sharp angles or protrusions have square-like discontinuities.
The points of these objects are then entered into a lookup table where they are evaluated and plotted by an oscillator. When the evaluating oscillator is cycled at 20 Hz (the lower range of human hearing) or higher, the object becomes audible. The shape and sculptural properties of each object are expressed as clangorous, pulsating timbral changes; smooth shapes have a strong fundamental frequency with minimal high harmonics, while angular objects are rich in odd harmonics. The x values of the object are panned to hard left and y values to hard right, resulting in a tightly synced two-channel stereo image.
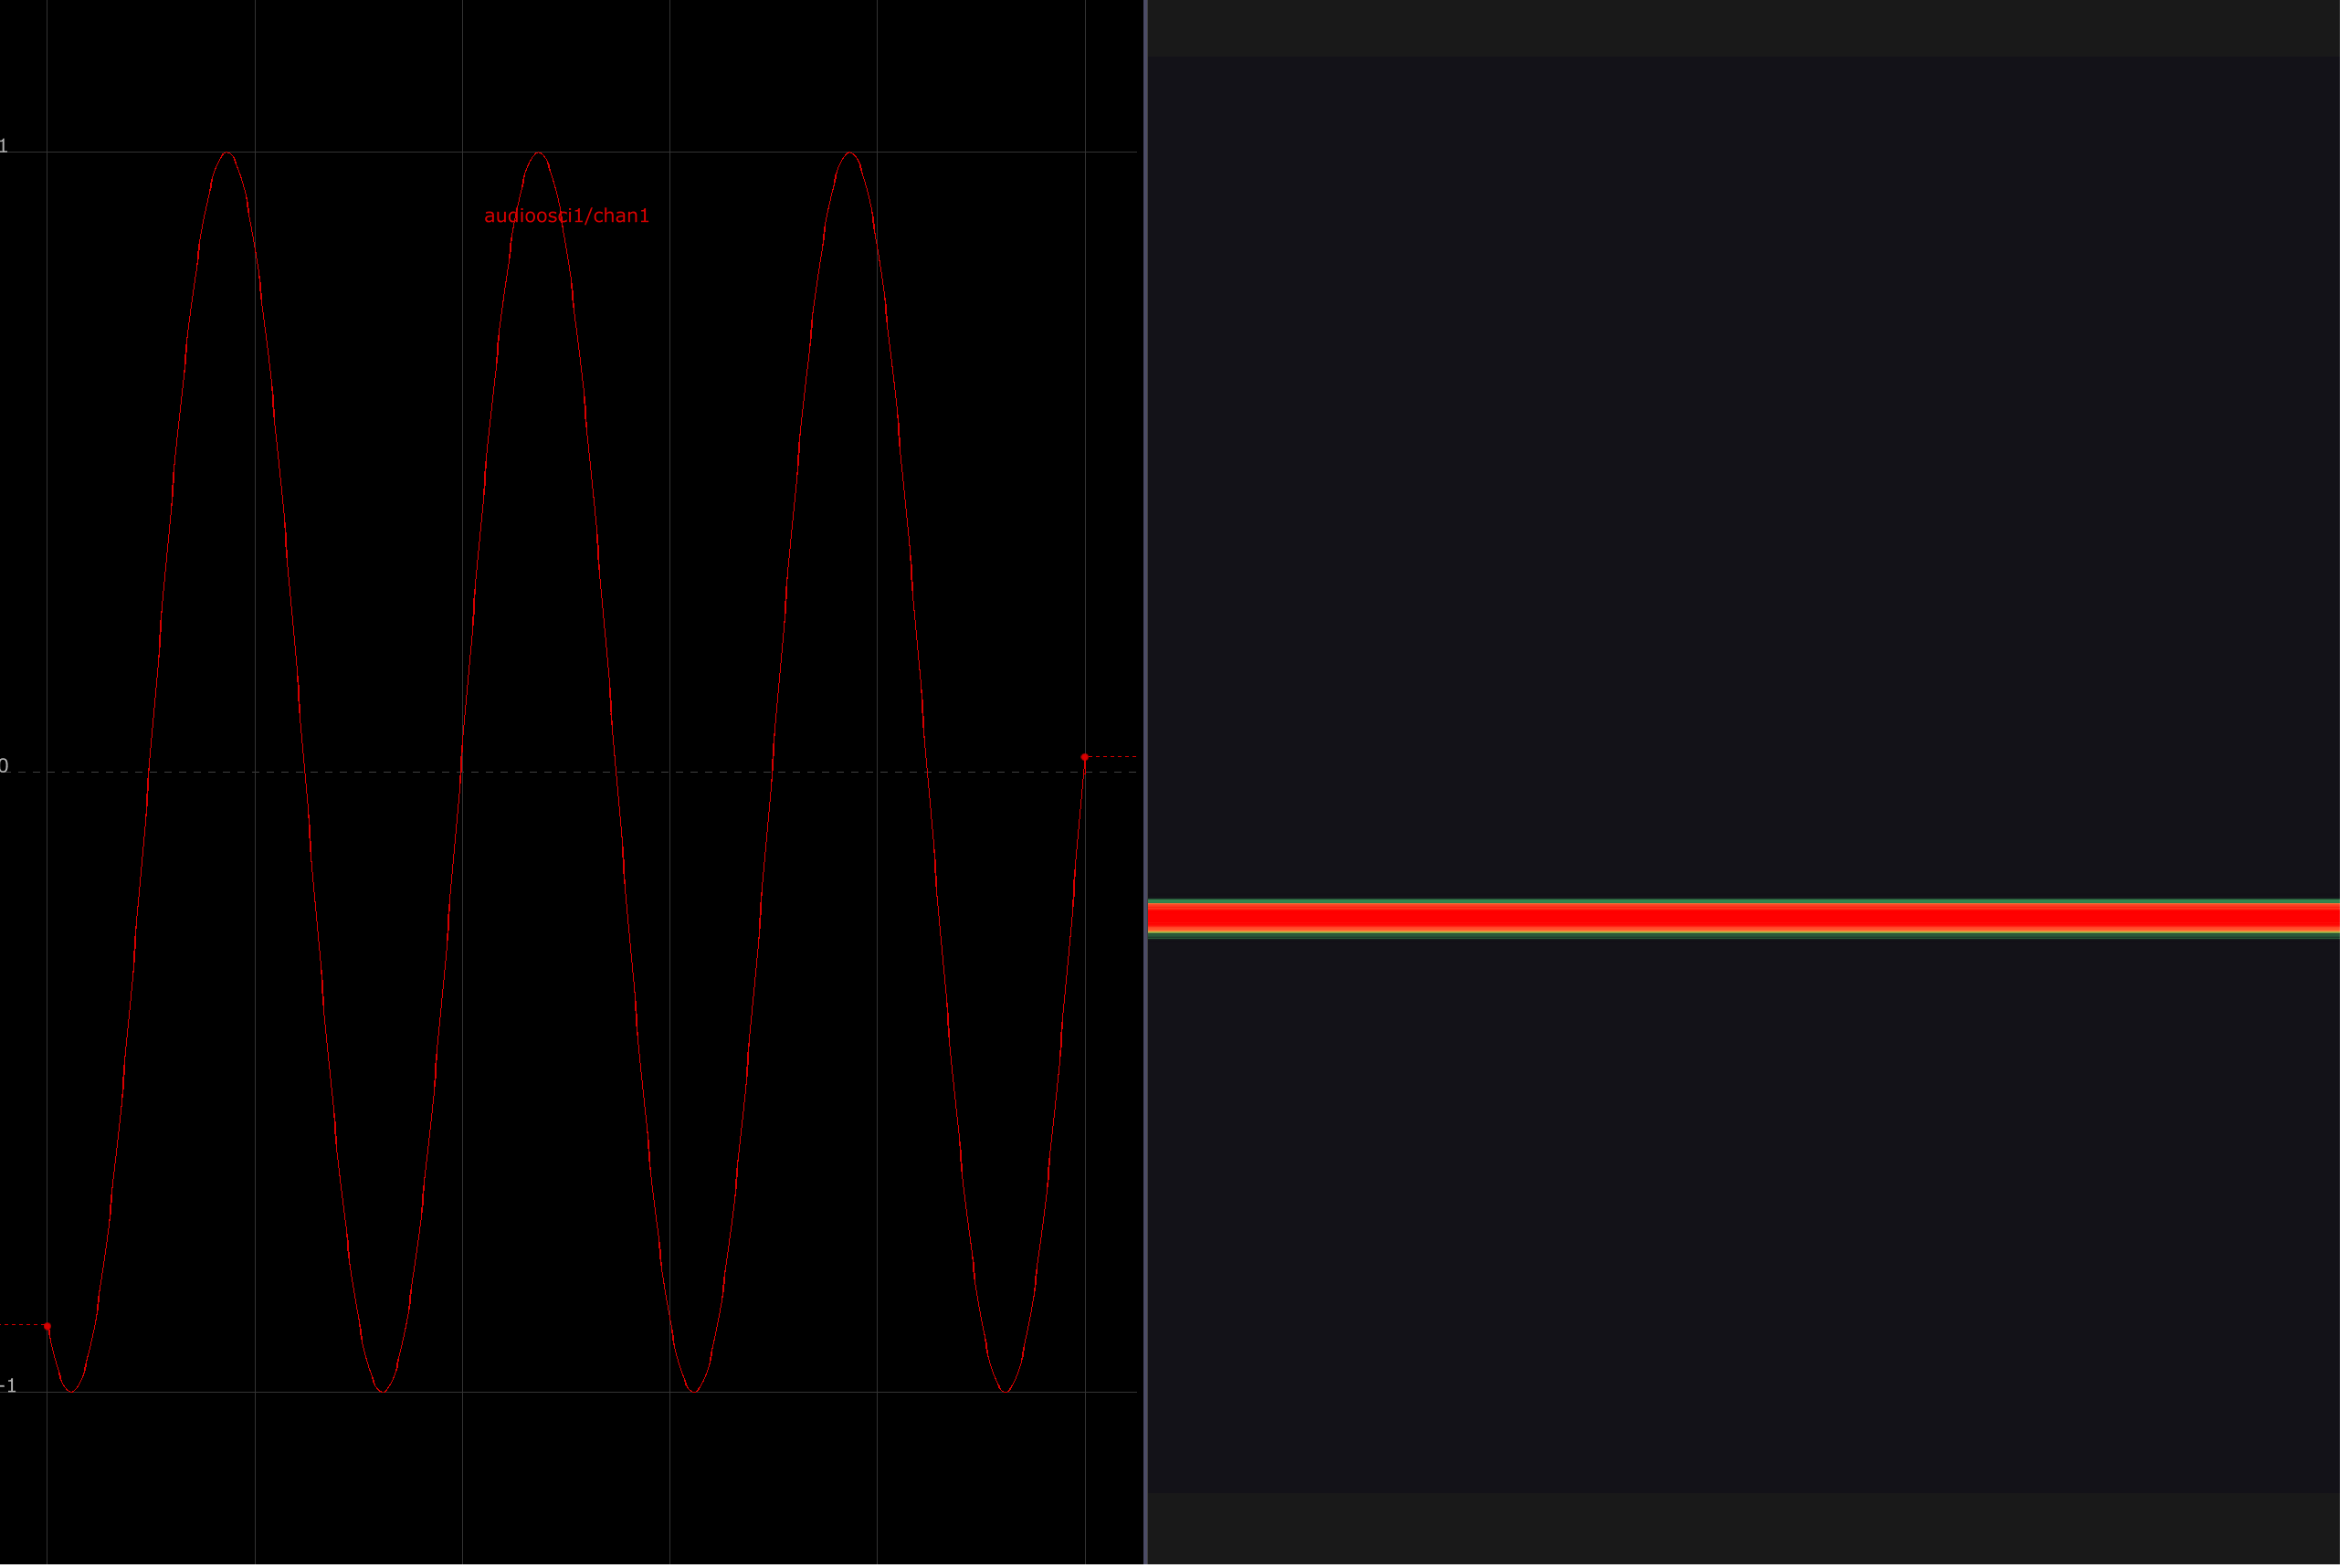
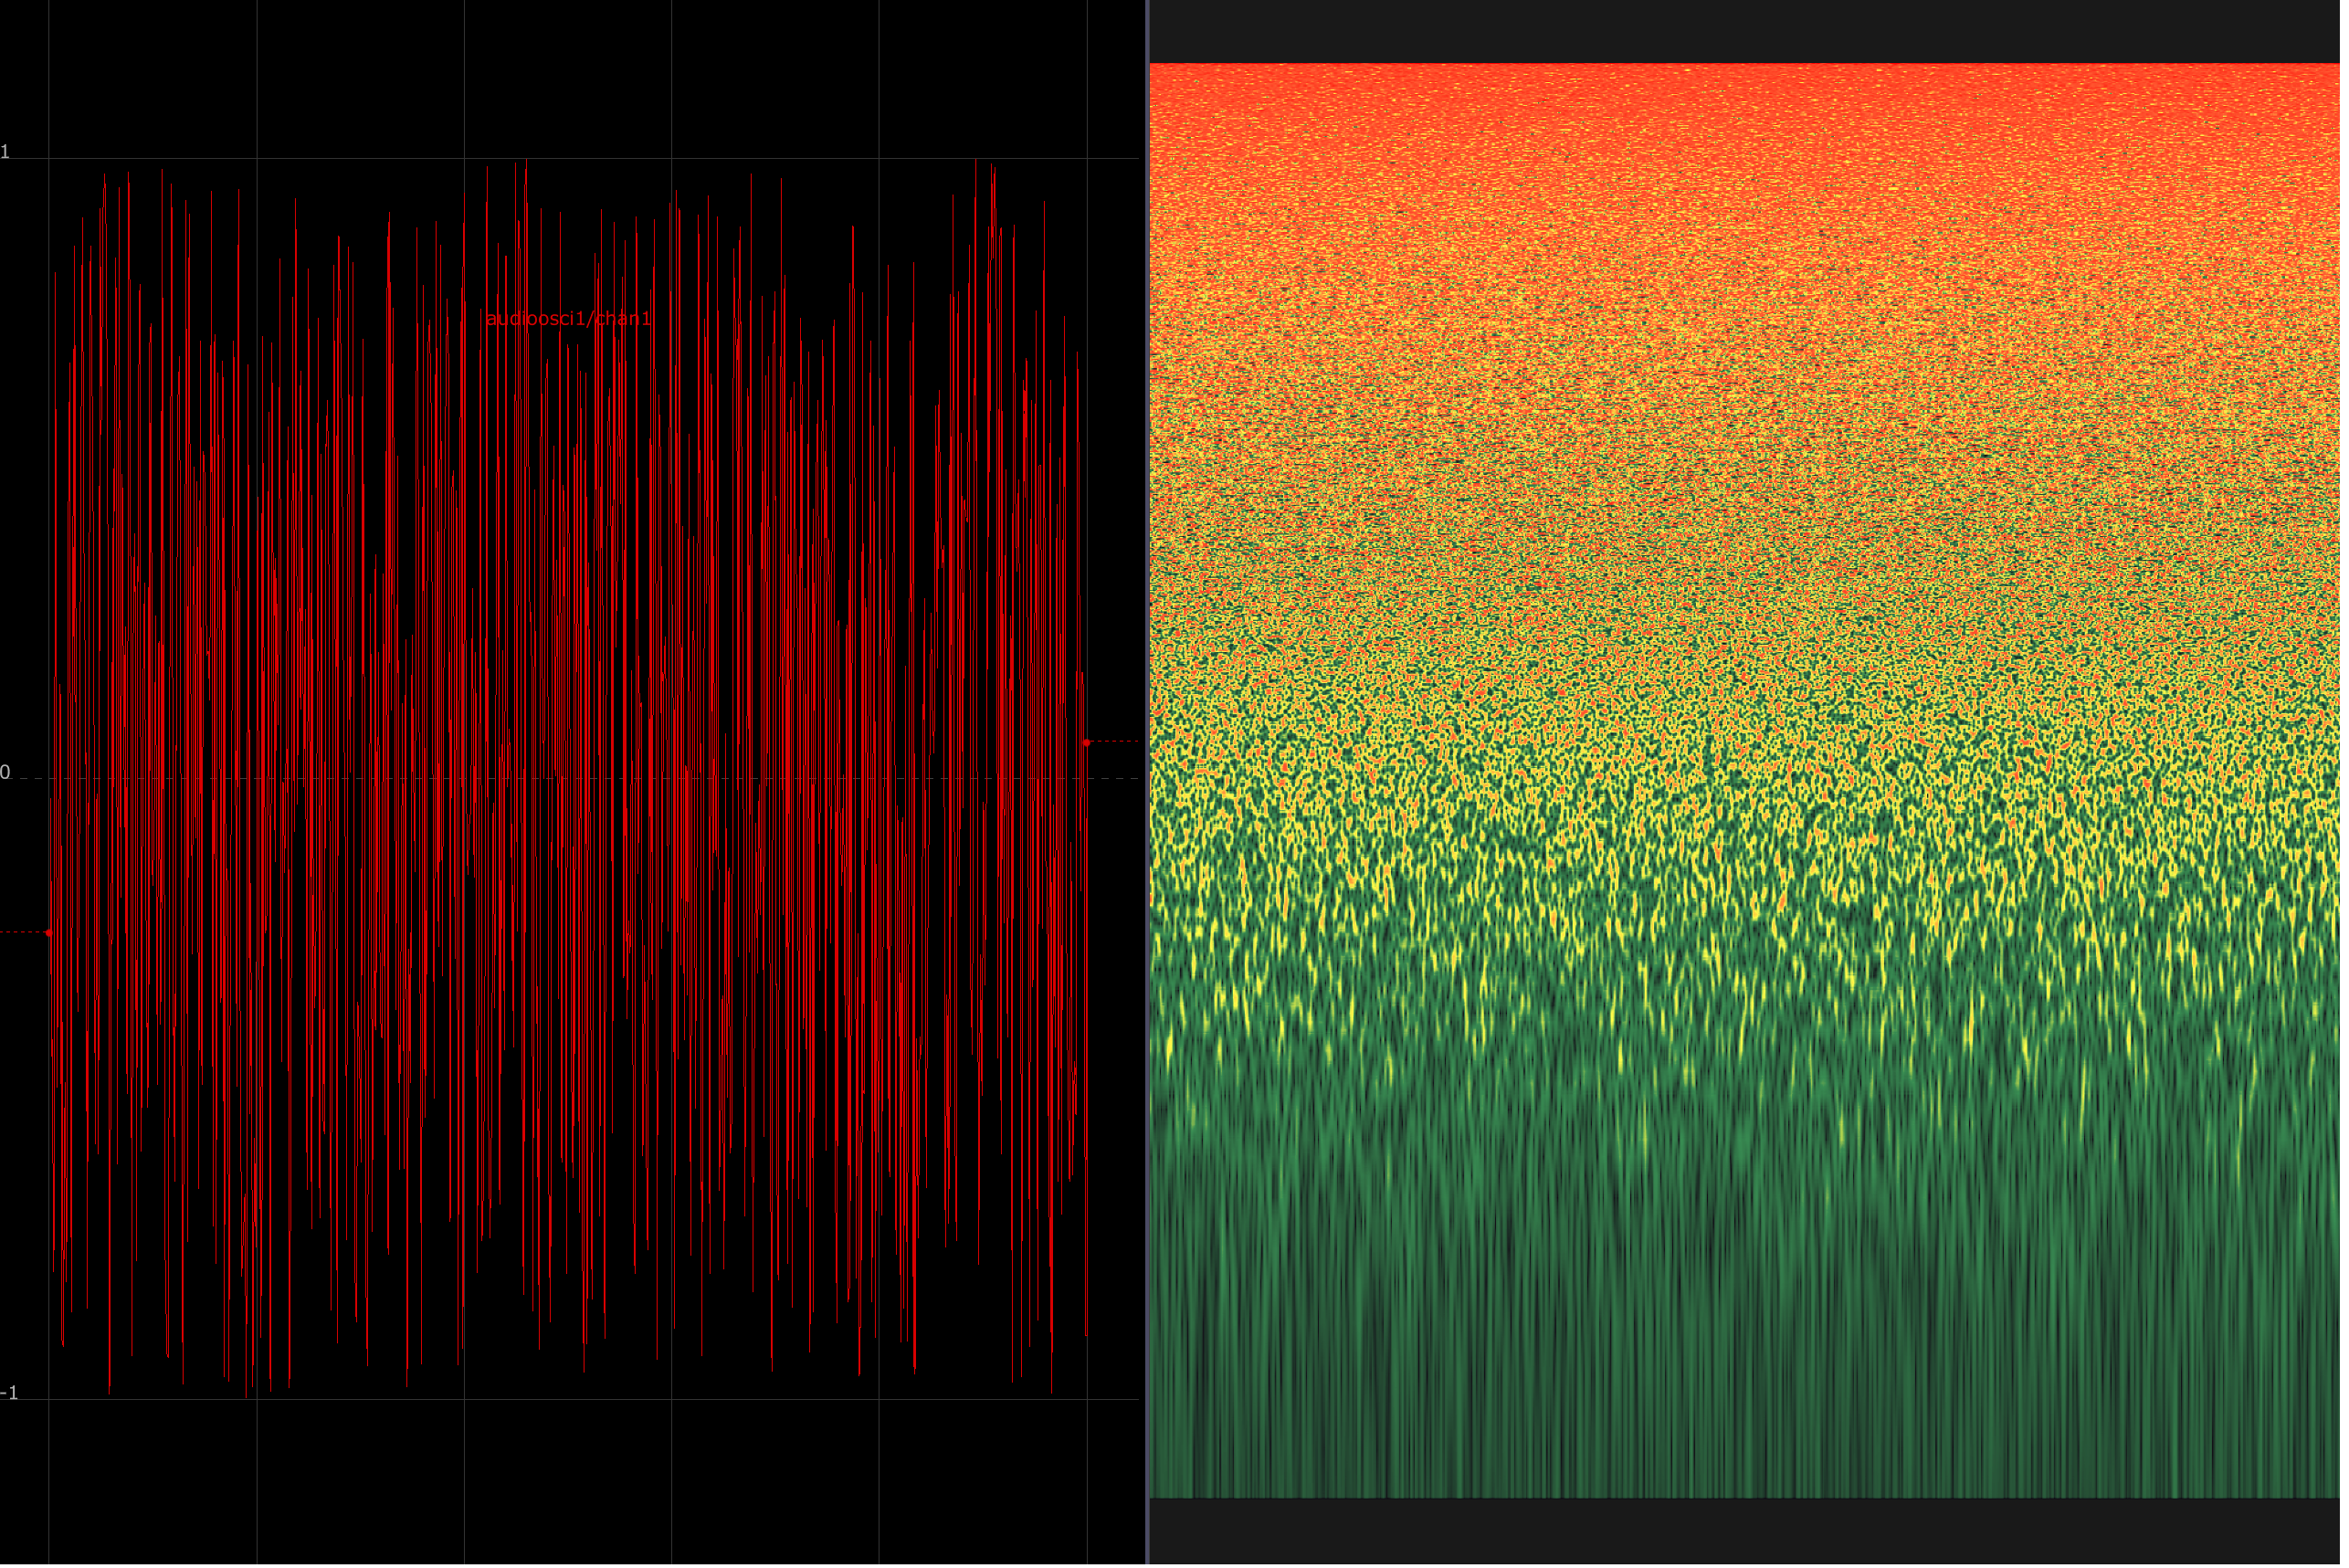
In the three images below, a waveform is displayed on the left, with its corresponding spectrogram depicted on the right. Spectrograms show the relative amplitude of various frequencies in a signal. The y-axis corresponds to frequencies from low to high, and the right axis plots time. In these examples, the signal is held constant to draw attention to their spectral makeup.
A 220 Hz sine wave has no overtones or harmonics, just a strong fundamental.
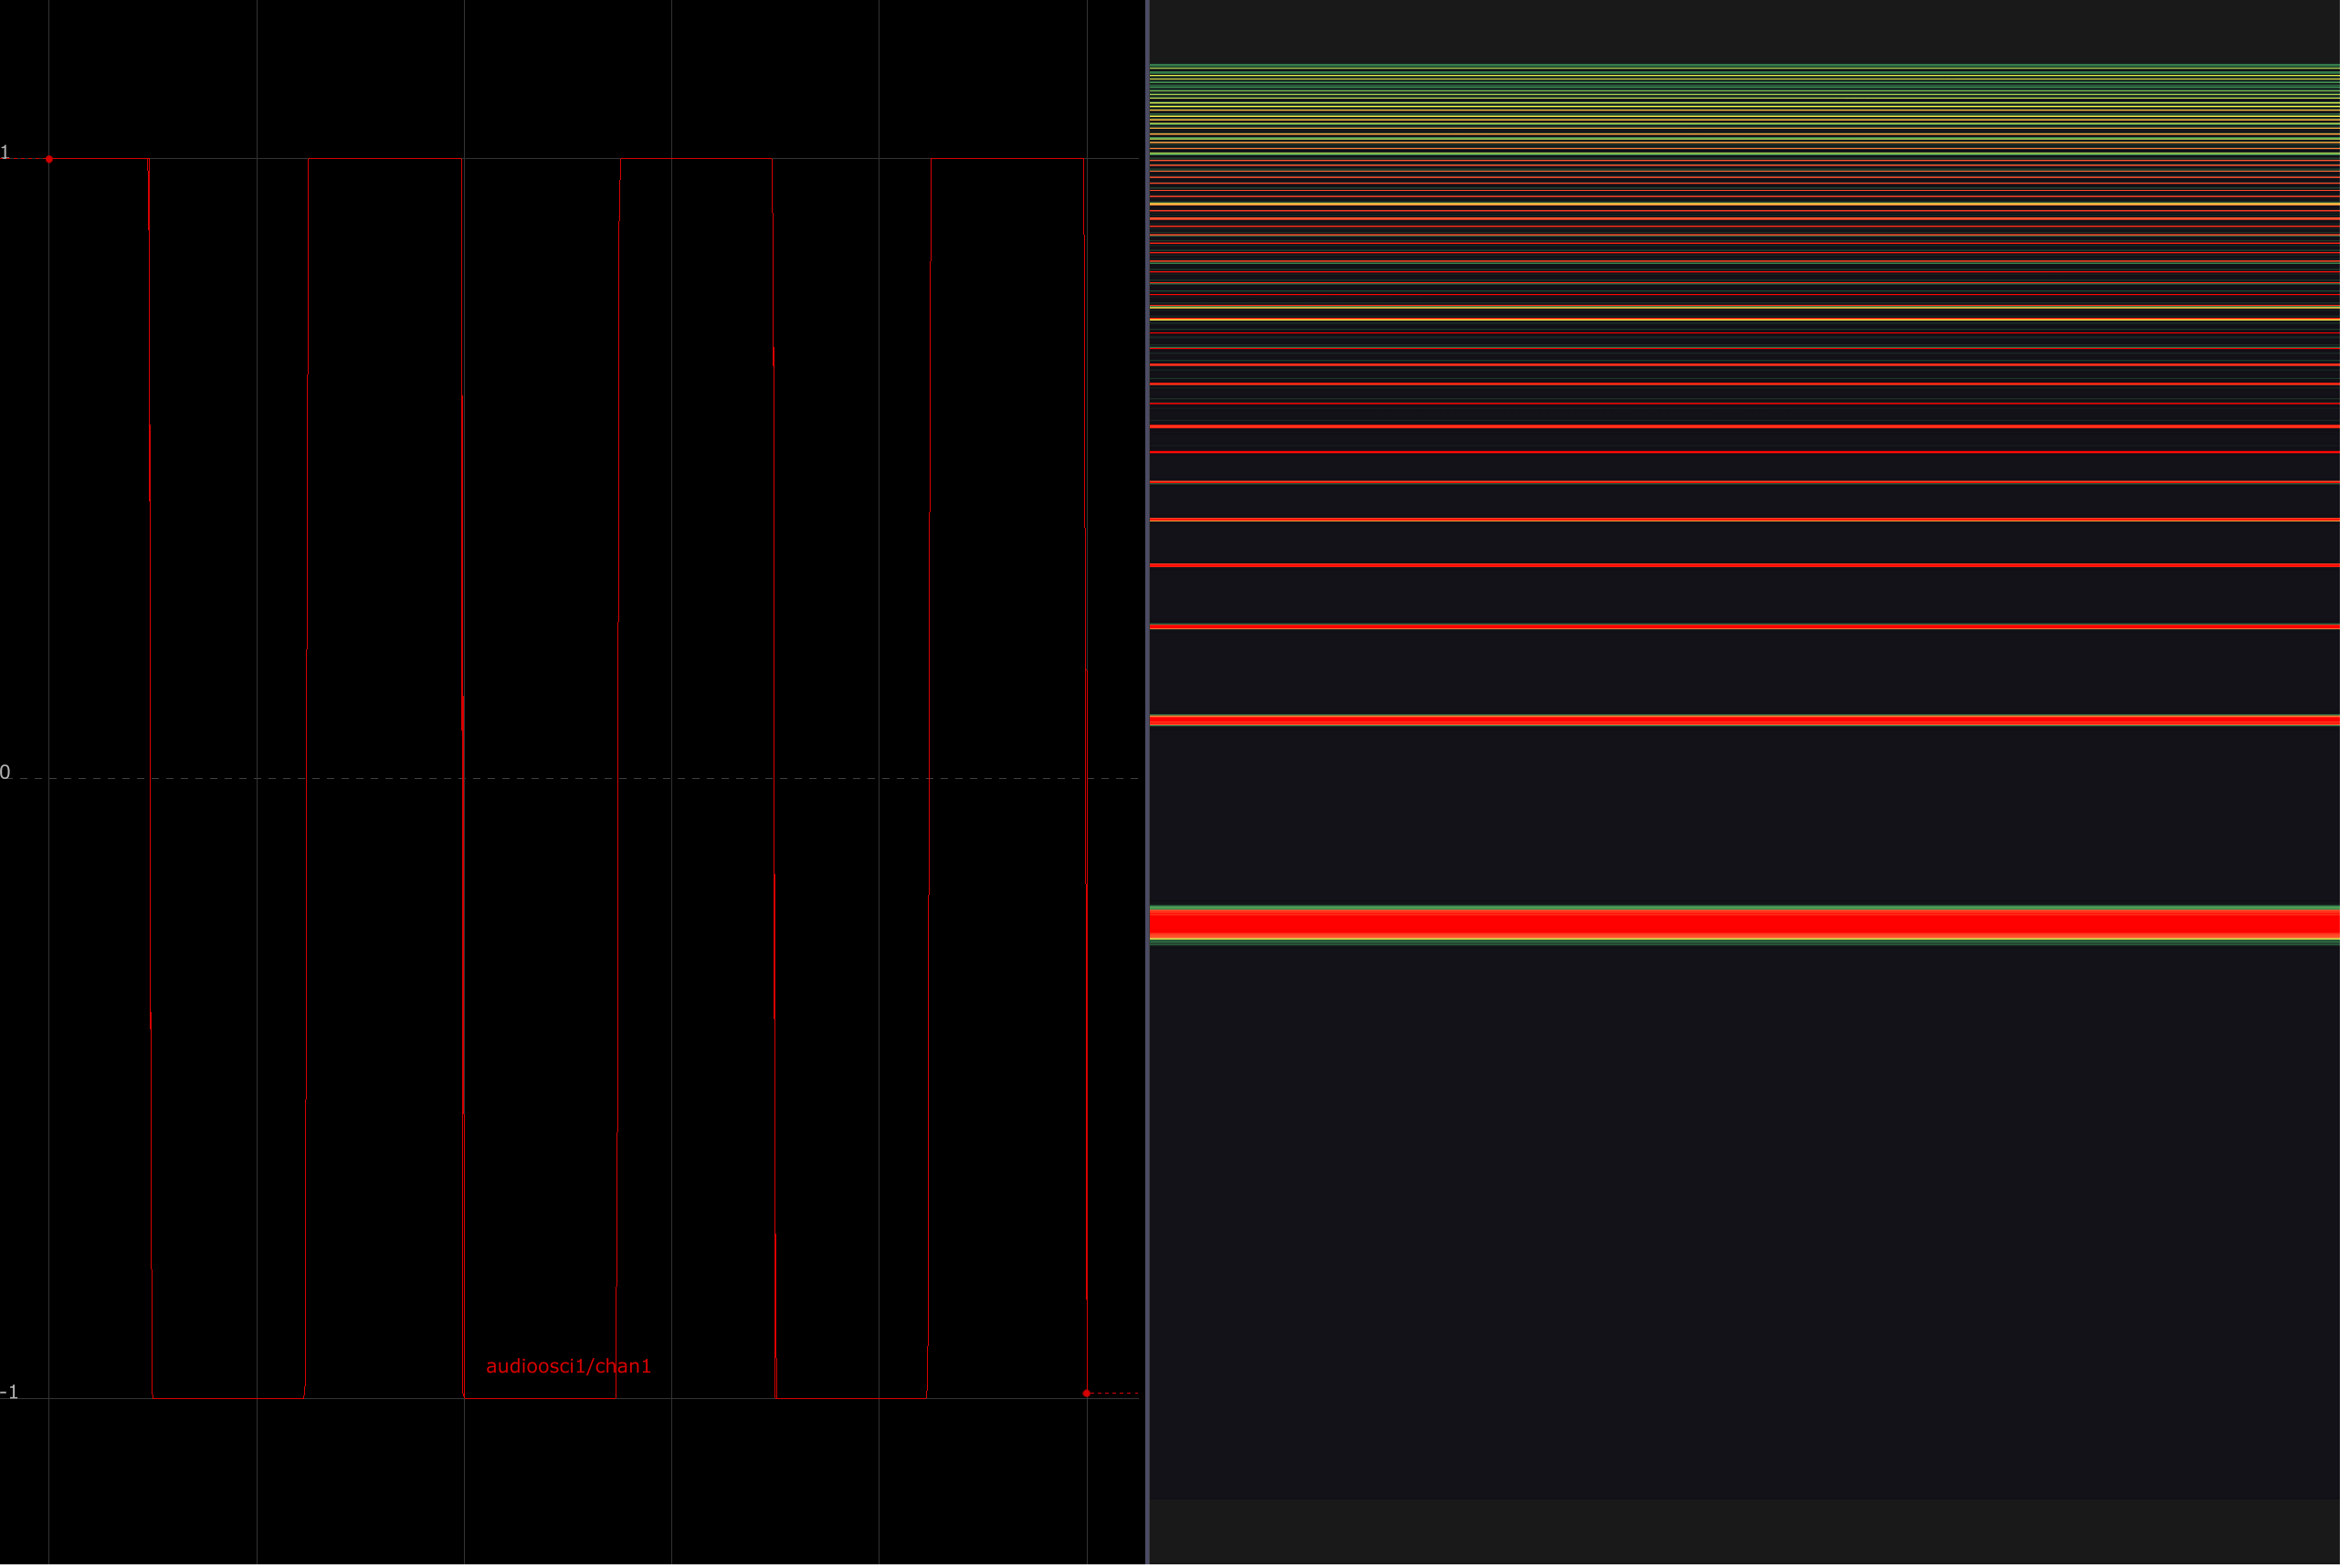
A square wave, meanwhile, is rich in odd harmonics:
A white noise signal results in a relatively even distribution of harmonic spectra:
The second part of the algorithm functions like a custom oscilloscope, in which the x, y, and z channels of each object are plotted at audio rates that result in a strobing, deconstructed rendition of the source object. The interplay and aliasing between the evaluation rate of the lookup and the animation's capture rate of sixty frames per second create stuttering after-images and “frozen” states in which objects’ motions appear to lock into new configurations.
This transformation of a 3-D object into sound introduces unique possibilities not previously associated with 3-D animation. When an object is processed as sound, it can be filtered, equalized, mixed with noise, and crossfaded with wavefolded versions of itself. The resulting distortions play out across sound and image, focusing attention on how sonic and visual complexity is apprehended. These complex interpolations between sound and image afford us a chance to relate harmonic spectra with visual features: What does a handful of repeating lines sound like? What does an assuring rumble look like?
This project takes inspiration from the wavetable synthesis methodologies employed by Industrial Music Electronics founder Scott Jaeger in his design of the Piston Honda Mk3 oscillator, as well as the wave morphing techniques made possible by Paul Schreiber's WaveEdit tool.
[1]